
Dashboard Overview
The Pool Runs dashboard provides a real-time overview of your entire pool service operation. From here, you can monitor technician progress, track financial metrics, and quickly access common tasks.
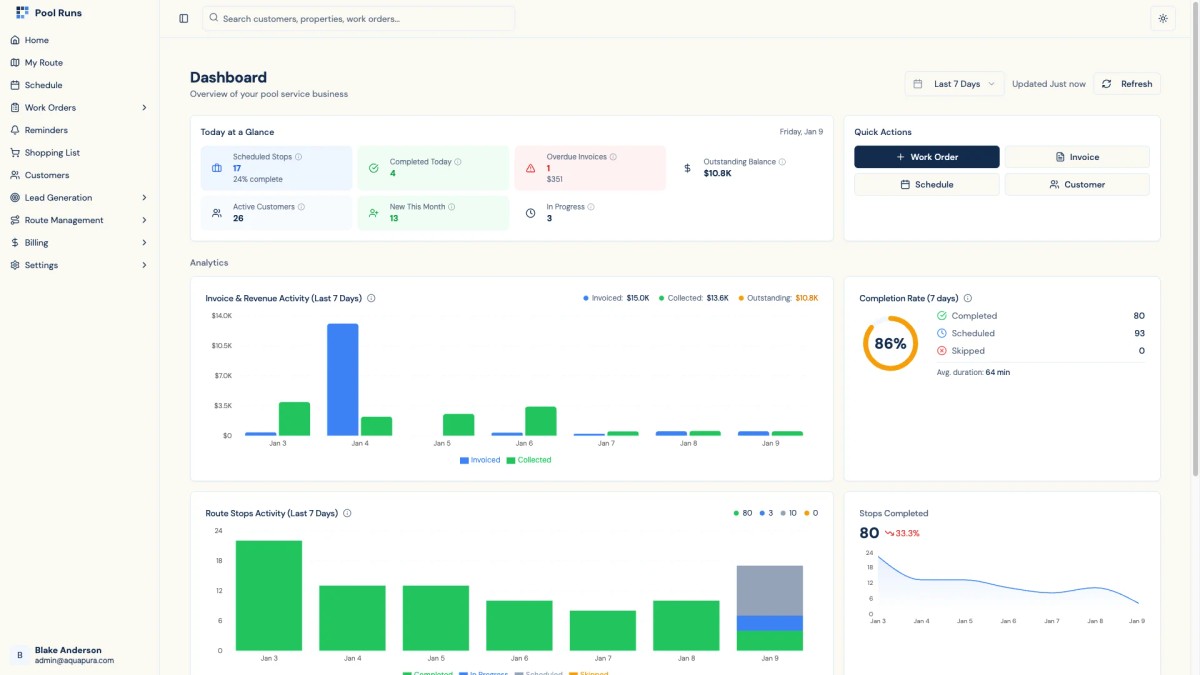
Today at a Glance
The top section of your dashboard displays key metrics for the current day, giving you an instant snapshot of your business operations.
Operational Metrics
- Scheduled Stops - Total number of route stops and work orders scheduled for today
- Completed Today - Number of stops that have been finished, with completion percentage
- In Progress - Stops currently being serviced by technicians in the field
Financial Metrics
- Overdue Invoices - Count and total dollar amount of past-due invoices requiring attention
- Outstanding Balance - Total amount owed across all unpaid customer invoices
Customer Metrics
- Active Customers - Number of customers with active service status
- New This Month - Customers added during the current calendar month
Real-Time Updates
All metrics update automatically as your team completes work throughout the day. Click on any metric card to navigate directly to the relevant section.
Charts & Analytics
The dashboard includes several interactive charts to help you visualize business performance over time.
Invoice & Revenue Activity
This bar chart compares invoiced amounts versus collected revenue:
- Blue bars show the total amount invoiced per day
- Green bars show payments collected
- Summary totals display invoiced, collected, and outstanding balance for the period
Completion Rate
A visual progress ring shows your 7-day completion rate with color coding:
- Green indicates excellent completion (90%+)
- Yellow indicates moderate completion (70-90%)
- Red indicates low completion (below 70%)
The card also shows completed, scheduled, and skipped stop counts along with average service duration.
Route Stops Trend
Track your service volume over time with a stacked bar chart showing stops by status: Scheduled, In Progress, Completed, and Skipped. This helps identify patterns in your daily operations.
Date Range Filtering
Use the date range selector above the charts to view historical data. Available options include:
- Last 7 Days - Rolling week (default view)
- Last 30 Days - Rolling month
- Last 90 Days - Rolling quarter
- MTD - Month to date (from 1st of current month)
- Last Month - Previous calendar month
- YTD - Year to date (from January 1st)
Quick Actions
The Quick Actions panel provides one-click access to the most common tasks:
- Work Order - Create a new work order for repairs or one-time services
- Invoice - Generate a new invoice for a customer
- Schedule - View and manage the route schedule
- Customer - Add a new customer to your system
Keeping Data Fresh
The dashboard displays a "Last updated" timestamp in the header. Click the refresh button to manually update all metrics and charts with the latest data.